pi – or the colors in me

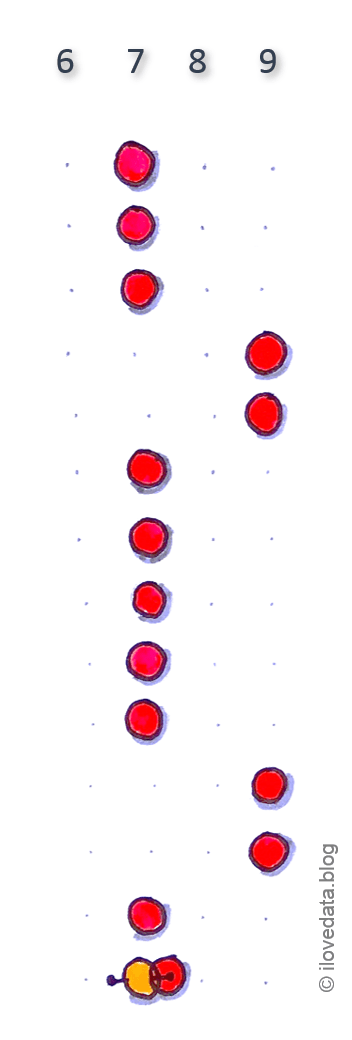
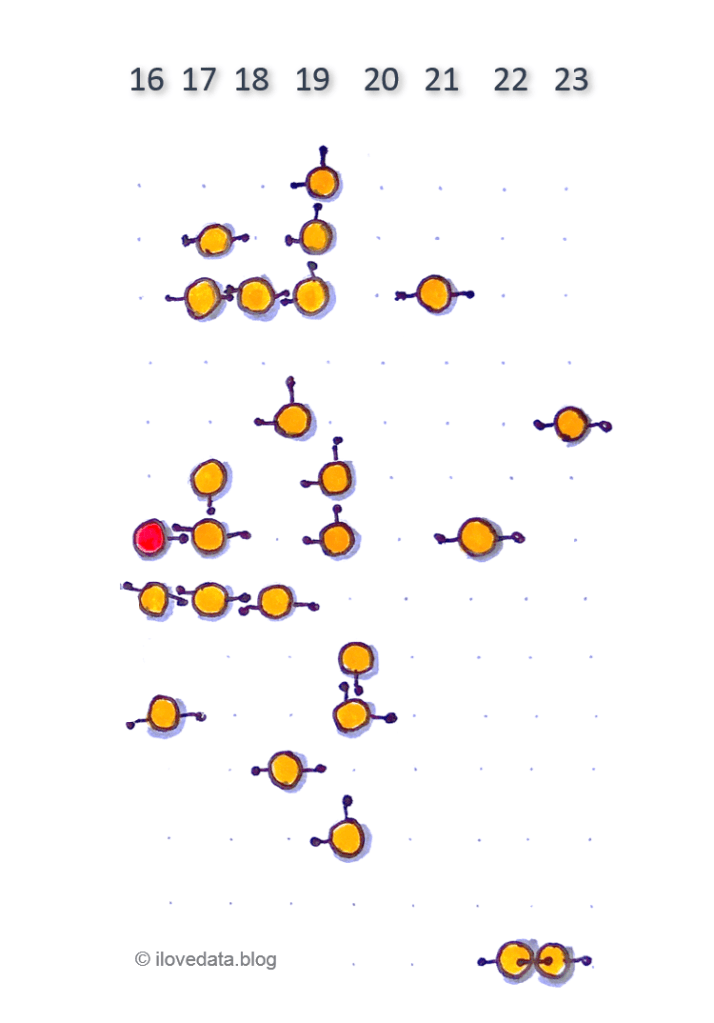
Inspired by the number pi, I started working on a new encaustic piece using the first 500 digits of pi. 

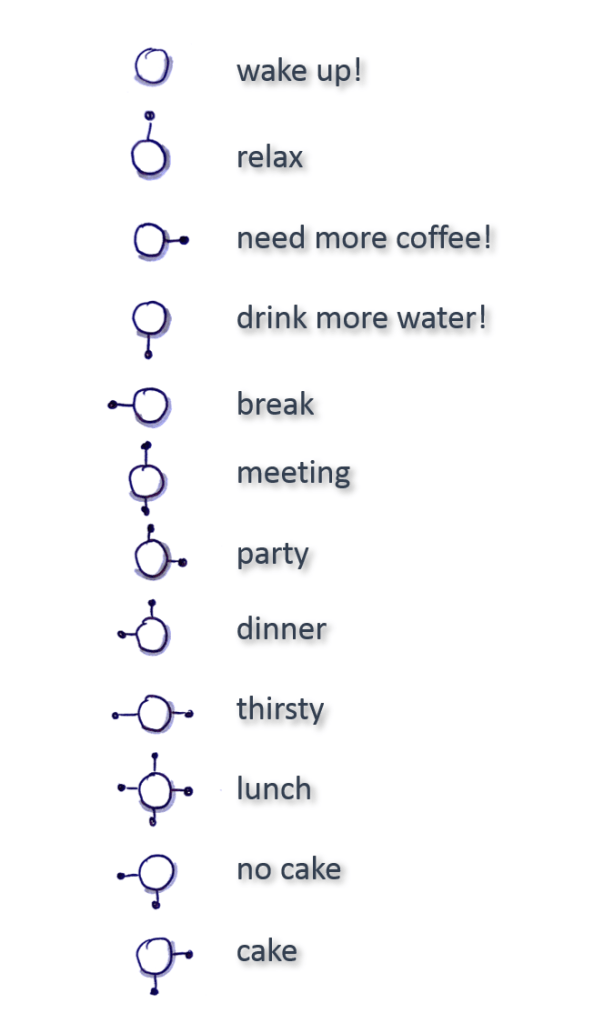
As for me numbers have colors (e.g. 4 is blue), I thought why not share that with you – make a data visualization – and give you some colorful insights. 

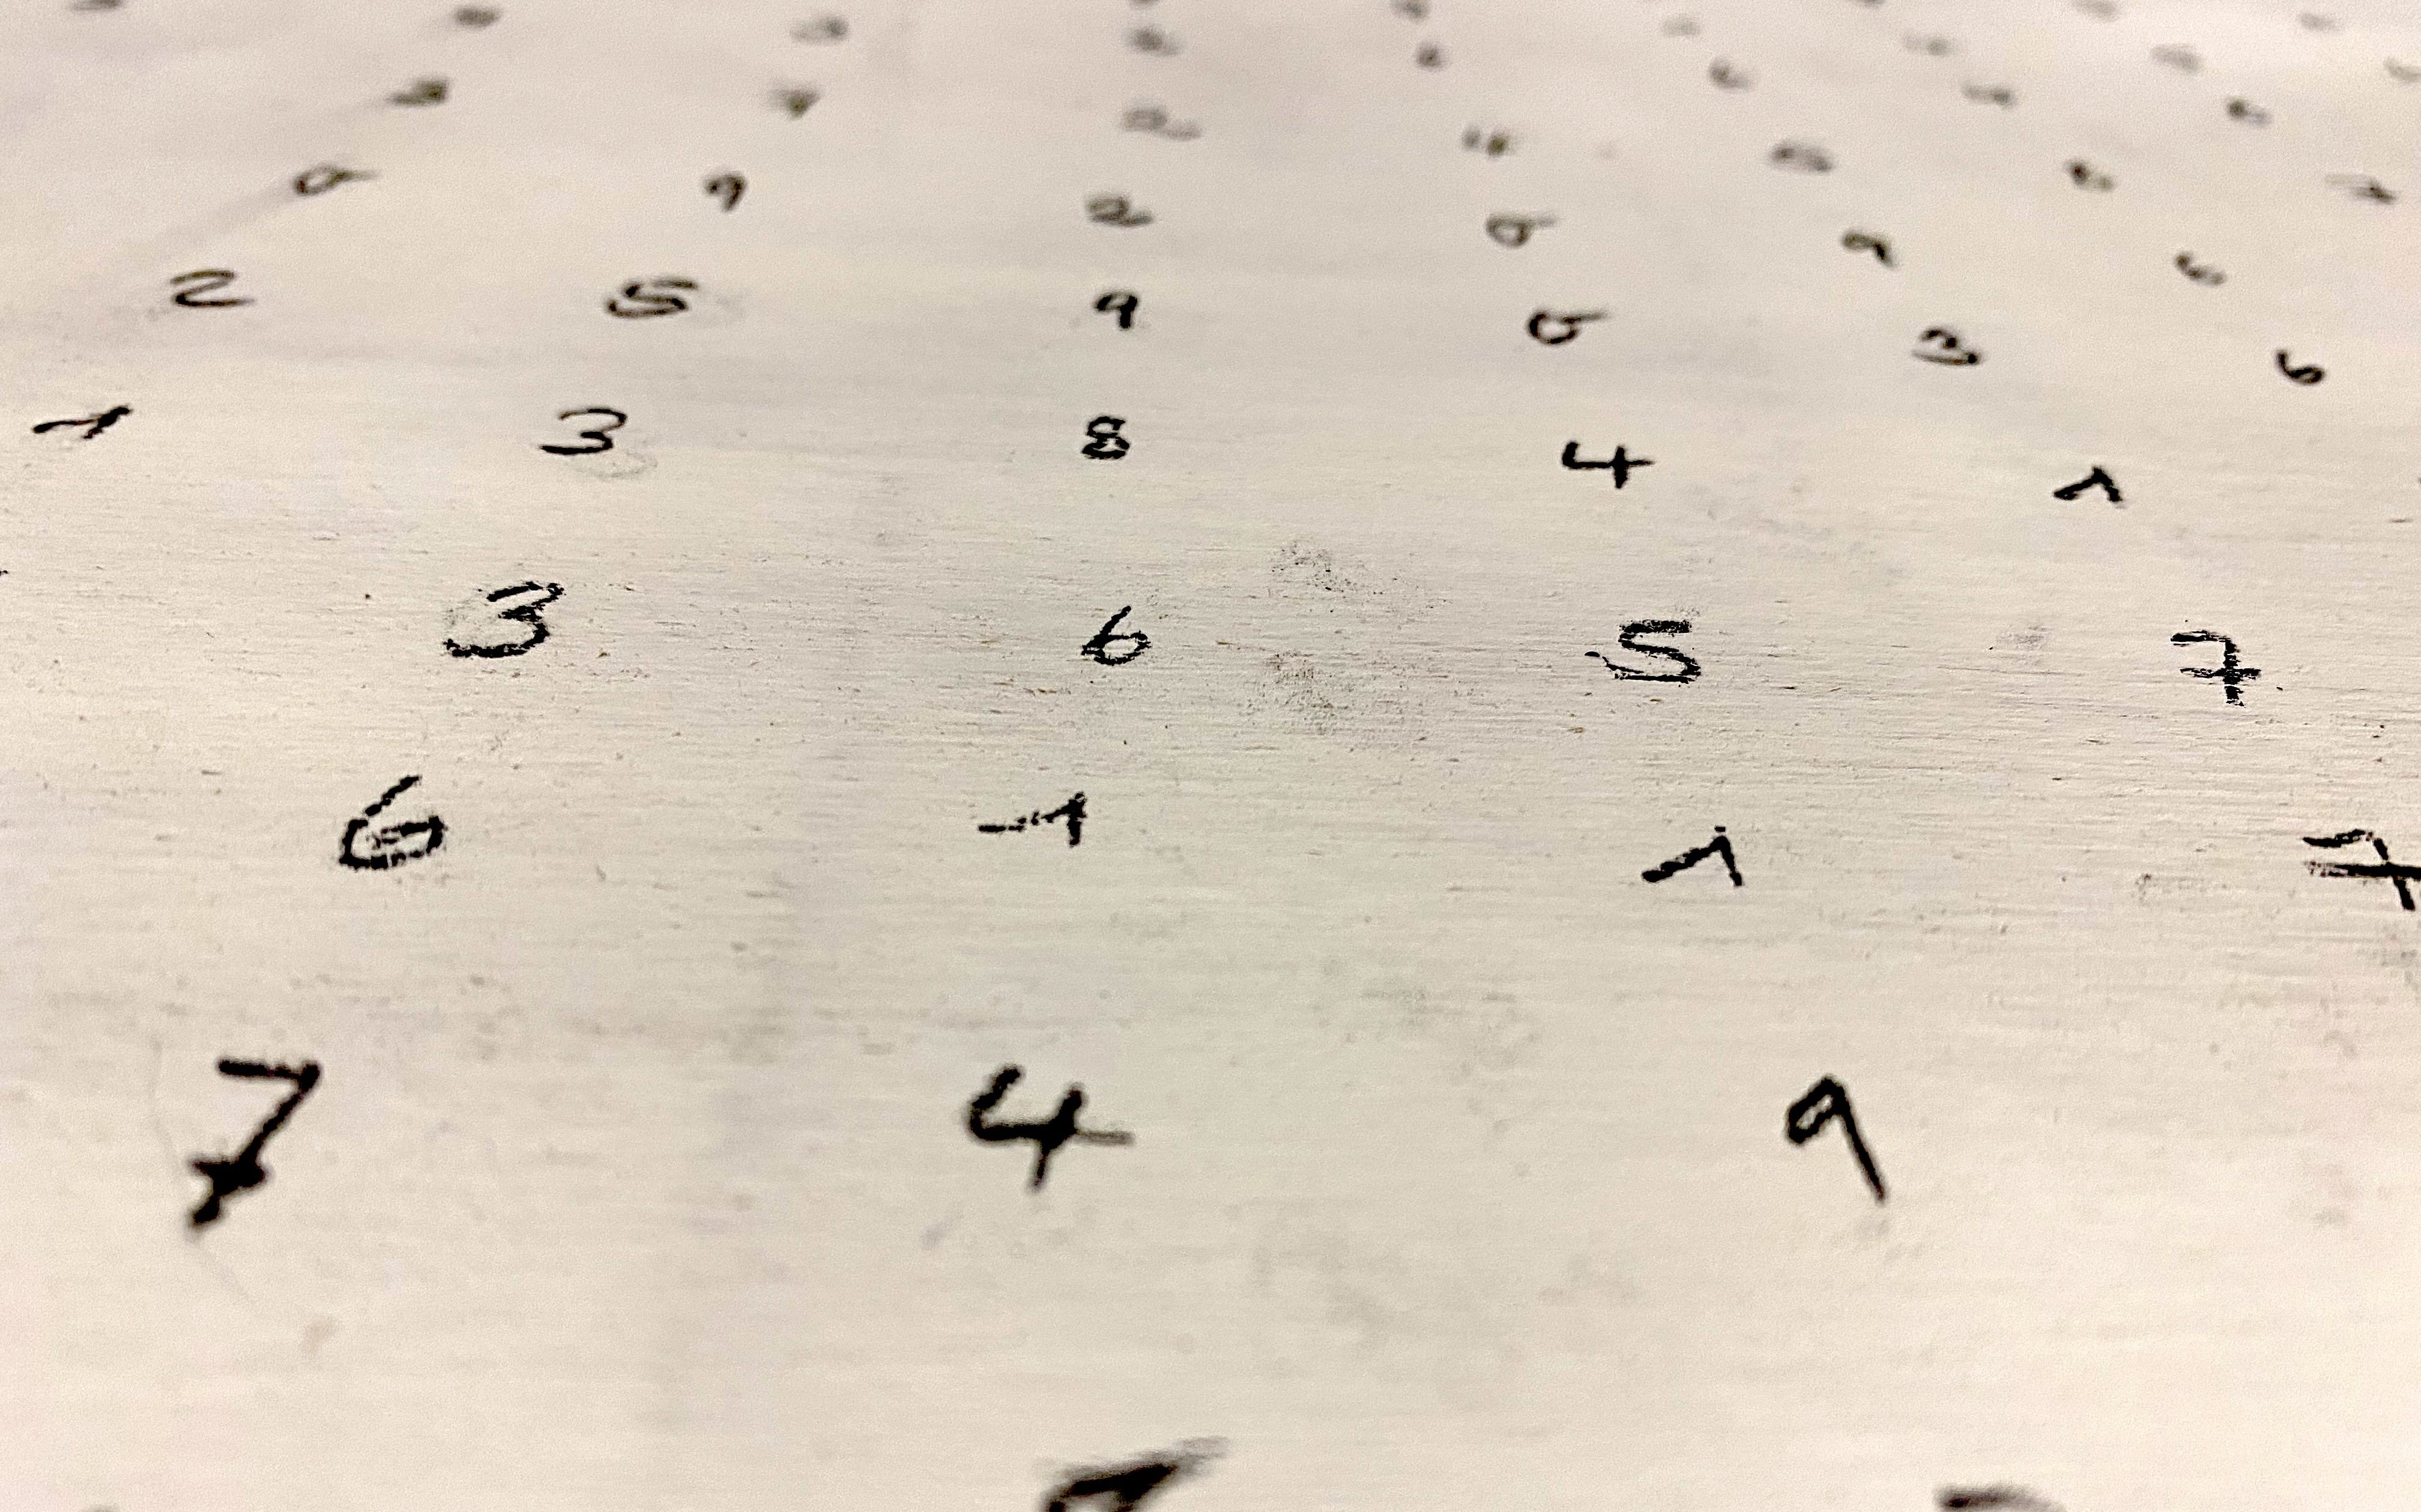
So, I started writing down all 500+ numbers on a big wooden panel. This was my template to guide me.

It‘s getting preeeetty colorful

With the first color dots, it actually looked like a board game and I was not shure if I could stand it – way too many strong colors.

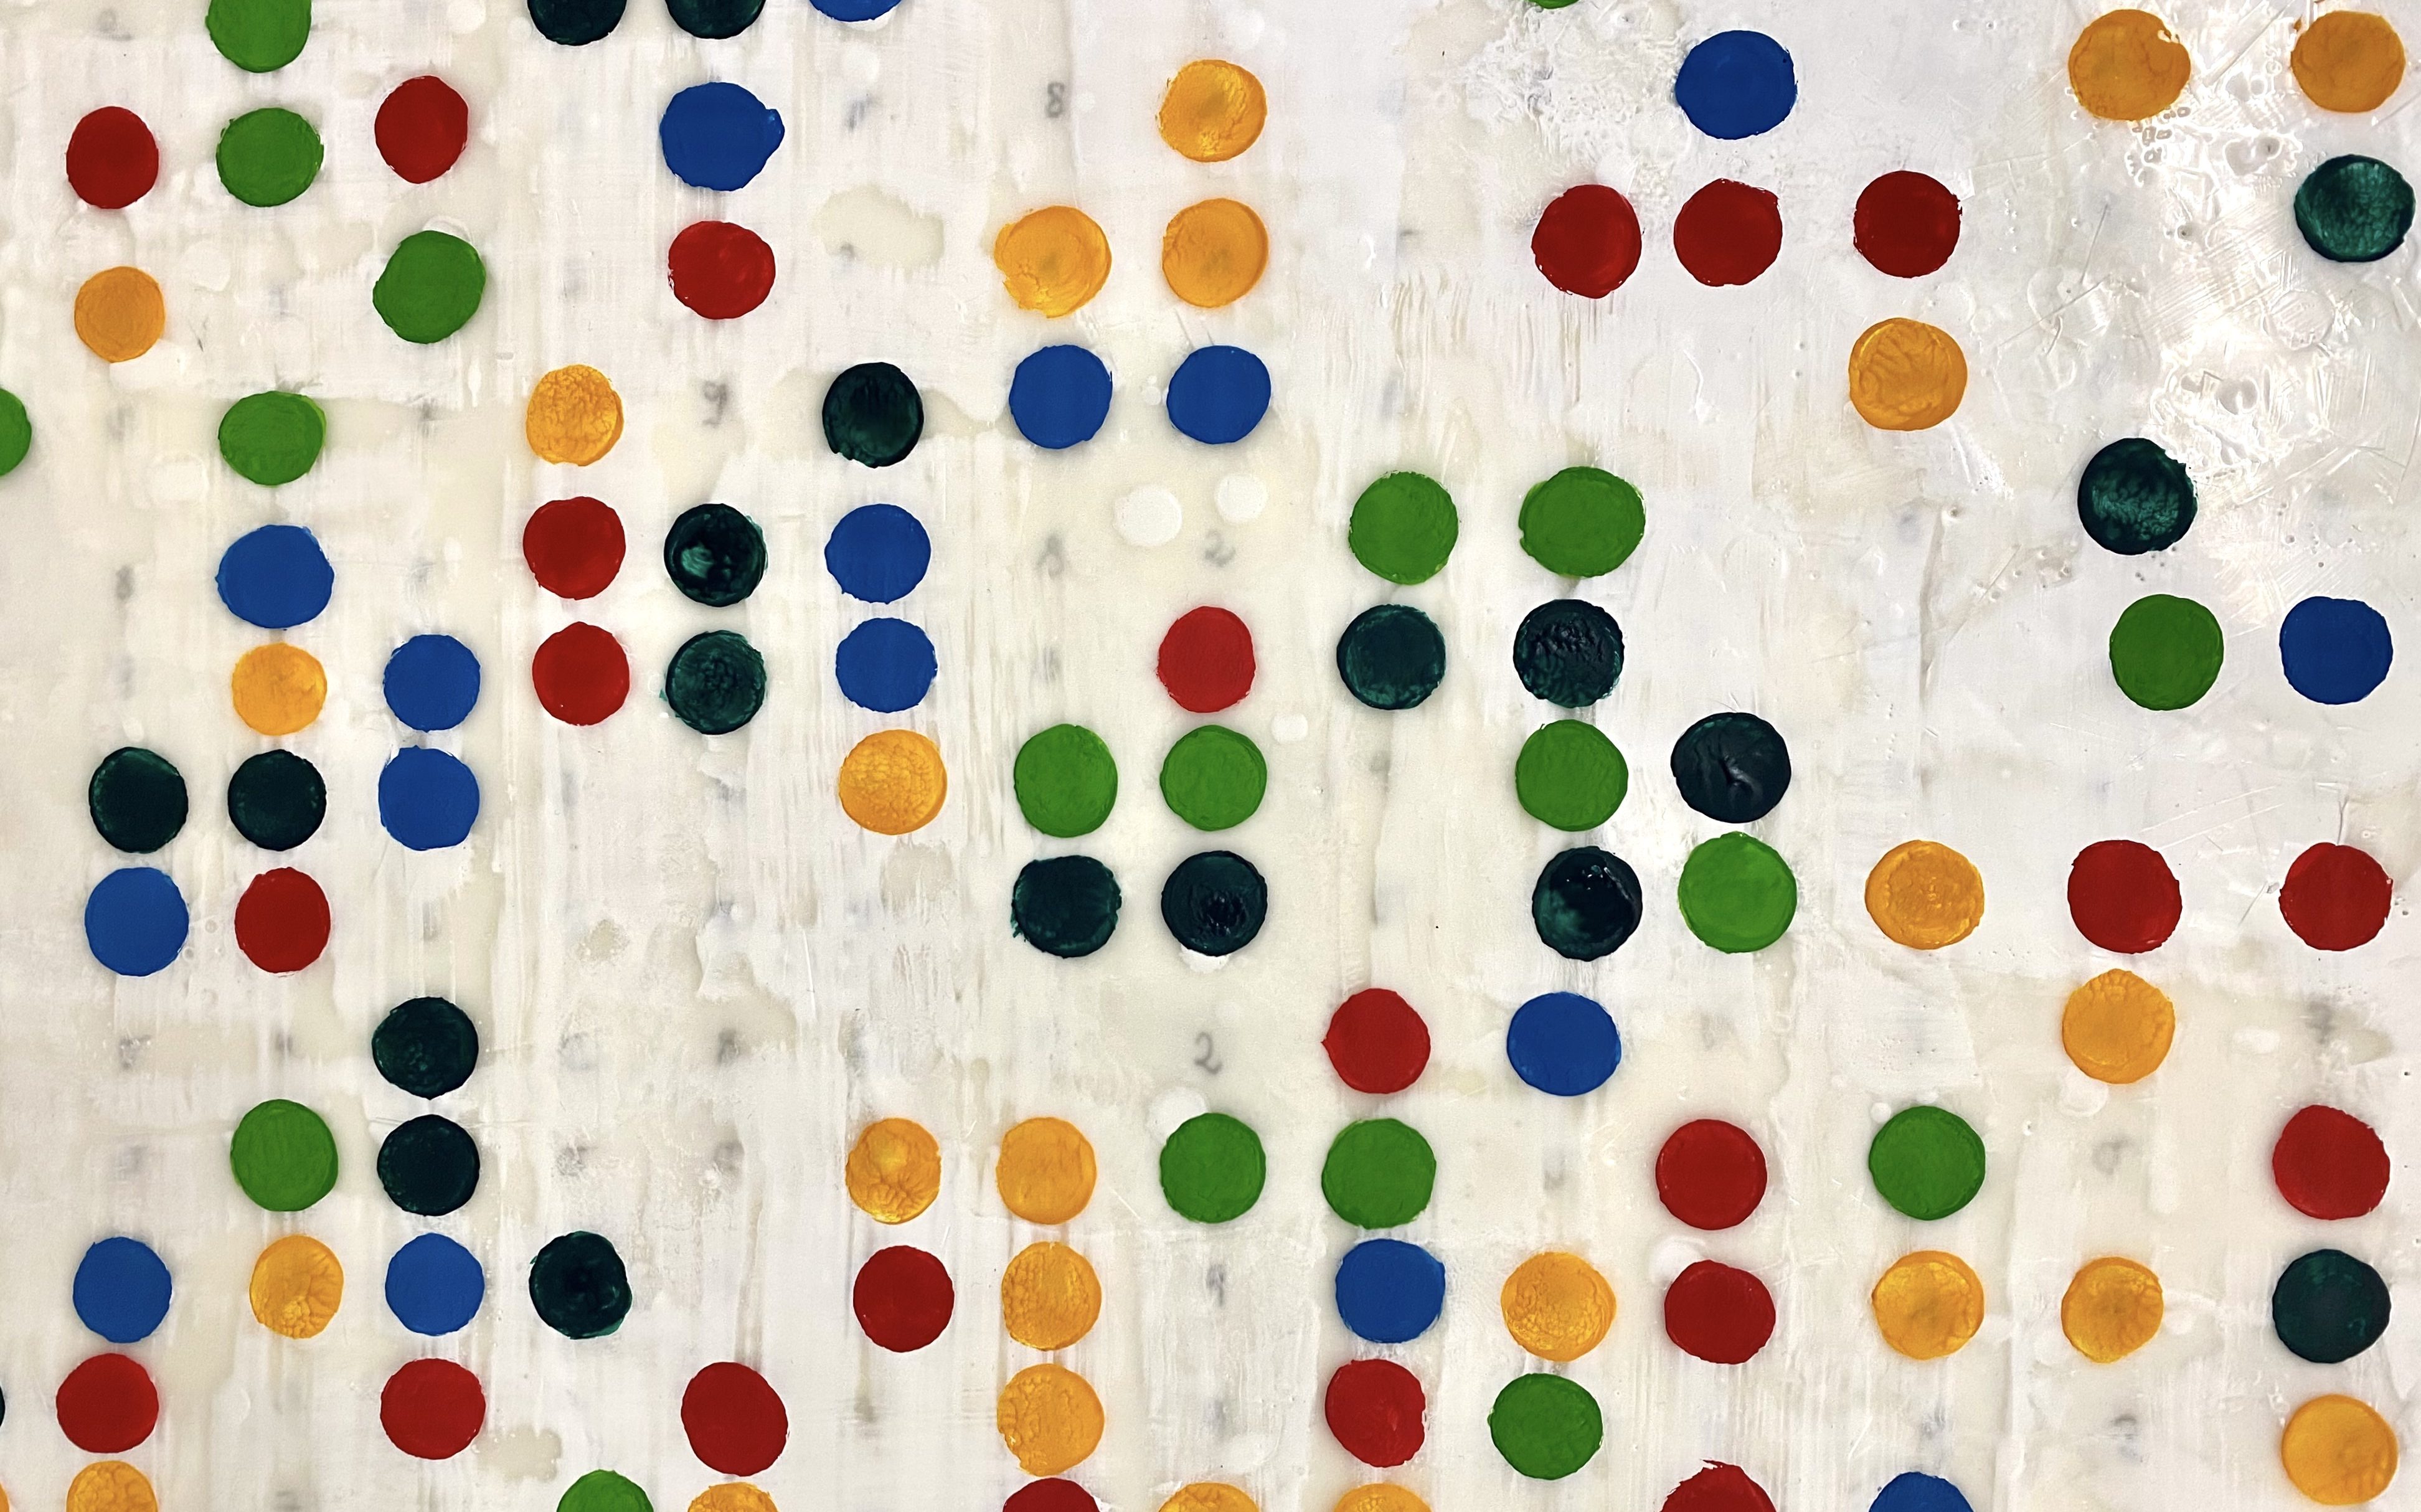
It was new to me, that I could not decide where to put the color. The design was defined by the numerical order of pi. 

And although, I could have decided to go with different colors, I could not. As this is how I see the numbers 0-9, I had to move on with my inner color palette.

Why do I see numbers in colors?

Synesthesia is a perceptual phenomenon in which stimulation of one sensory or cognitive pathway leads to involuntary experiences in a second sensory or cognitive pathway. So, the definition. (thanks wikipedia)

In one common form of synesthesia, known as color-graphemic synesthesia, letters or numbers are perceived as inherently colored.

Does anyone have a green 3?

As far as I can say, it has always been like that for me and I did not know that this is kind of weird.

Well, I do remember my friends staring at me when playing cards and I asked “does anyone have a green 3?”
(and we were not playing UNO).

Who else?

I’d love to get to know more people with synesthesia and learn all about the sameness and the differences in our perception.

So, in case you see numbers or letters or music in colors, or know somebody who does, please feel free to reach out to me.

What has happened with ‘pi’ so far?

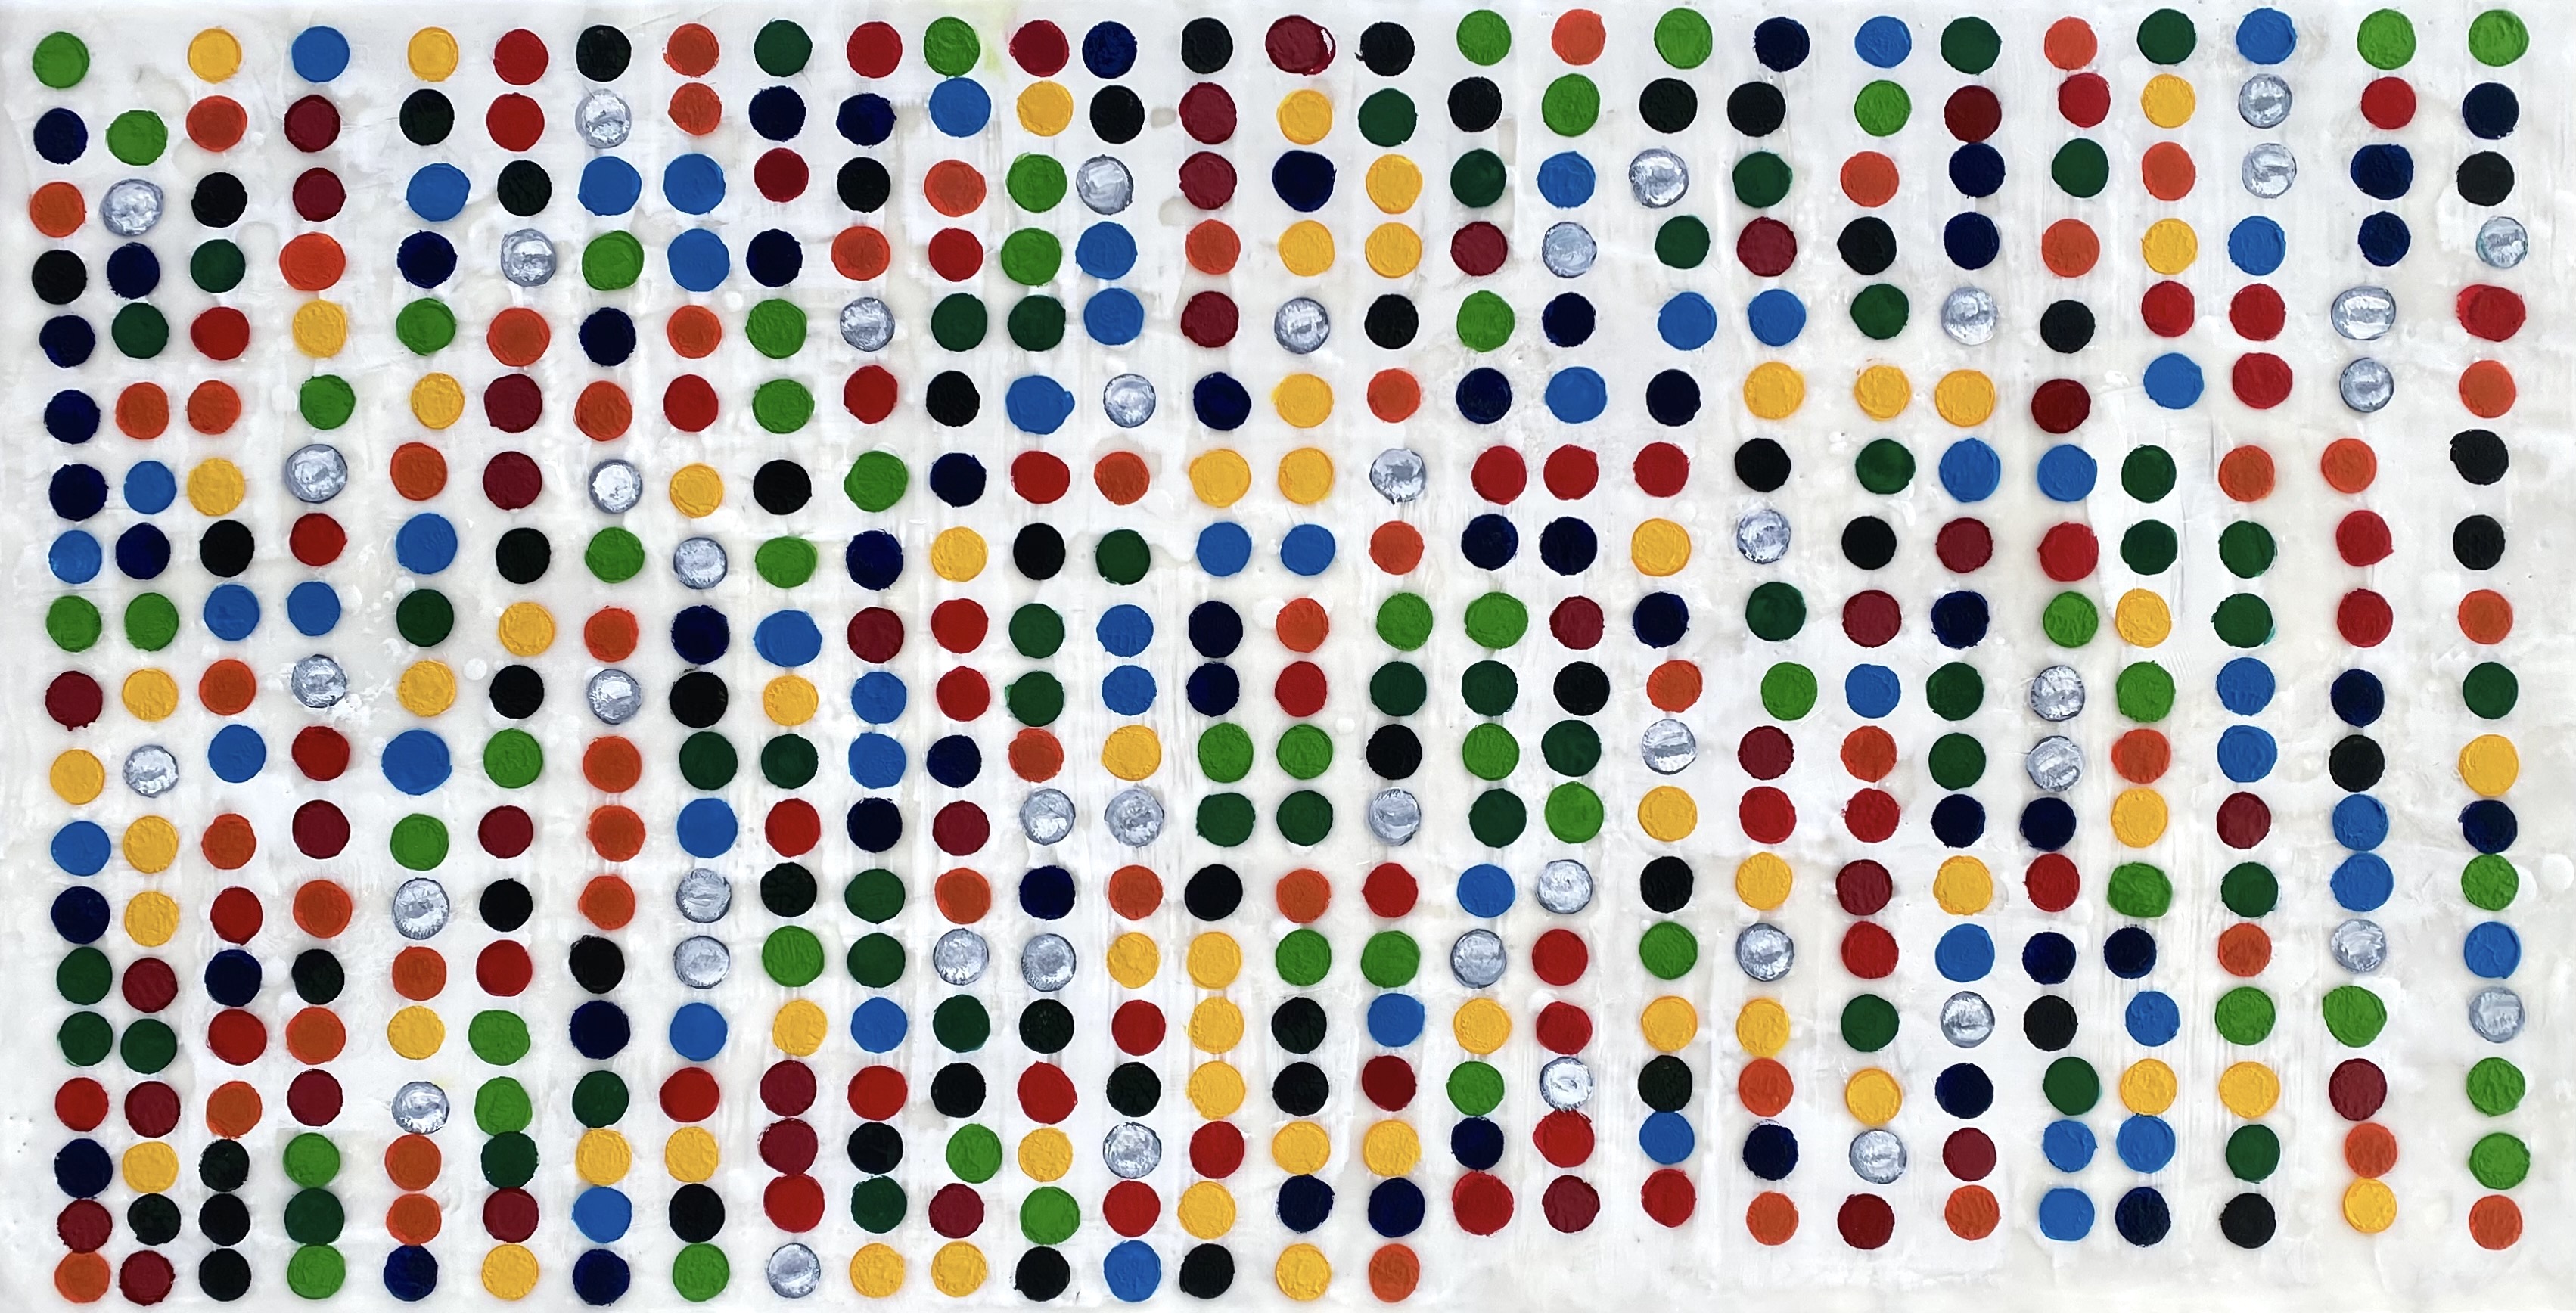
Every single number on the panel from 0 to 9 got its color dot – 500+ digits (!)
So, voilà this is how I see pi!

Since then, the piece got several layers of beeswax (wax, fire, scrape, wax, fire, scrape, … ). I covered it with black oil paint – wohoo! Wiped away the black to receive beautiful lines, I had scraped in the wax before.

I am not done with it yet and need to proceed. Not knowing where all this will end up.

But that’s another story, right?

I data me ;)

Not long ago, I came across Dear Data, a wonderful project from Giorgia Lupi and Stefanie Posavec, which resulted in a fantastic book.

„Data can make us more human and help connect with ourselves and others at a deeper level.“

Each week, and for a year, the two collected and measured a particular type of data about their lives, used this data to make a drawing on a postcard-sized sheet of paper, and then dropped the postcard in an English “postbox” (Stefanie) or an American “mailbox” (Giorgia).

Thank you, thank you, thank you, …. you inspired me to start with my very own selftracking project.

Everyone knows how important it is to drink enough. According to several sources, two to three liters of fluid should be enough for a healthy adult per day.

So, I counted how often I drink coffee and how often I drink water. I also tracked when I drink coffee and when I drink water. Plus, I added some context.

Drawing a grid and inserting the data points, this is how my data visualization looks like:

the legend

Having some explanation is always good and helps you to tell your data story. While colour stands for coffee or water, the antennas mark the context and tell you when and why I was drinking.

my findings

Translating data into visualization has a big advantage: You can see patterns. Can you?

So, this is what I found out.

In two weeks time, I was drinking 27 cups of coffee and 58 glasses of water. That makes two cups of coffee and four glasses of water a day. Hm.

I need coffee to wake up and I need it every morning. This was not very new to me. But what you can see too is, that – at least for these two weeks time – I have a daily routine. And you can even see the weekends 😉

I drink more water in the afternoon and no coffee after four. (Probably, because our cafeteria is closed by then?)

There were 4 days, where I was drinking water because I was very thirsty.

What else? I never drink coffee and water at once. 😉

the learnings

I am okay with how much coffee I drink. Two cups a day, I am totally fine. I thought it would be much more.
But, I must drink more water. Four glasses a day is definitely not enough!

No need to worry.

According to different sources, the body can produce about 300 milliliters in its metabolic processes itself, about one liter of water he gets over solid food.

For example, apples, vegetables and potatoes contain about 70 percent water, cucumbers as much as 95 percent.

The remaining amount of liquid, so good 1 to 1.5 liters, you have to take on drinks. And that is possible. 🙂

side effects of selftracking

Tracking my behaviour, led almost automatically to paying more attention to it. You can see that with the data points and context drink more water!. Thus, I drink more water now.

Thoughts on the analysis and what to do different next time: I was not only drinking water and coffee during that time. To give a complete picture of my drinking behaviour, I could have added that too.

I love the dots and will do a new art project containing data.

I definitely gonna make more selftracking projects.
So, what to track next?

I can’t sleep cause my bed is on fire

I can’t sleep because my bed’s on fire
I can’t cope for another hour, oh no
I’m tired of being tired …

These lyrics of a Johnossi song come to my mind when describing the last few weeks. It felt quite hard trying to fall asleep, or waking up in the middle of the night and staying awake for hours. I have no idea why and wanted to know, is this something that only happened to me or what about other people? So, I looked at what people all over Europe shared on Twitter over the last 4 weeks and this is what I found out.

What is the reason, people can’t sleep?

Illness (24%) and noise (19%) are the most common reasons for people tweeting about no sleep. I could read of drunk people shouting in the street, neighbours playing music too loud, barking dogs, snoring husbands, babies, grandmas and pets.

A heartwarming amount of people (18%) couldn’t sleep because they were too excited. A closer look into the hashtags and tweets shows, what the excitement was about. Ticket sale started for BTS in London and many users couldn’t sleep because of that.

I feel sympathy for the 16% of tweeters that are kept awake by children, spouses, siblings and sleep-talking parents.

You might wonder about the 5% mentioning ‘hot’ with ’no sleep‘. These people couldn’t sleep because they were freezing and needed hot drinks and blankets.

When is it that people complain about no sleep?

In Europe, most people complain about having trouble sleeping between 1am and 2am.

Which countries are the most sleepless?

With 70% the UK has the most restless sleepers followed by Germany, Ireland, France and Spain.

UK got 70%? Why is that? That is not surprising and shows a weakness of my analysis in one aspect: not everyone in Europe tweets in English – certainly more users tweet in their mother tongue.

Leaving out the UK data, we get the following distribution:

Who can’t sleep?

Breaking these mentions down by gender shows an unfortunate trend for tired women. If you are female, it seems you are almost twice as likely to be complaining about not being able to get to sleep.

Hey wait, what about the moon?

I couldn’t find many tweets about sleeplessness and the moon. Hm, that is strange. Will have a closer look into that. 😉

Methodology: Analysis by collecting Twitter mentions from 1 Feb to 1 Mar, 2019 and extracting 890 mentions related to topics with Boolean based categorization.