
Not long ago, I came across Dear Data, a wonderful project from Giorgia Lupi and Stefanie Posavec, which resulted in a fantastic book.
„Data can make us more human and help connect with ourselves and others at a deeper level.“
Each week, and for a year, the two collected and measured a particular type of data about their lives, used this data to make a drawing on a postcard-sized sheet of paper, and then dropped the postcard in an English “postbox” (Stefanie) or an American “mailbox” (Giorgia).
Thank you, thank you, thank you, …. you inspired me to start with my very own selftracking project.

Everyone knows how important it is to drink enough. According to several sources, two to three liters of fluid should be enough for a healthy adult per day.
So, I counted how often I drink coffee and how often I drink water. I also tracked when I drink coffee and when I drink water. Plus, I added some context.
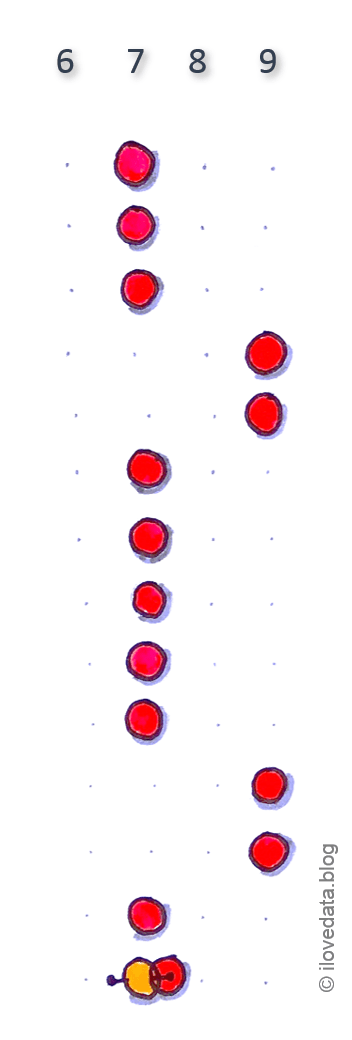
Drawing a grid and inserting the data points, this is how my data visualization looks like:

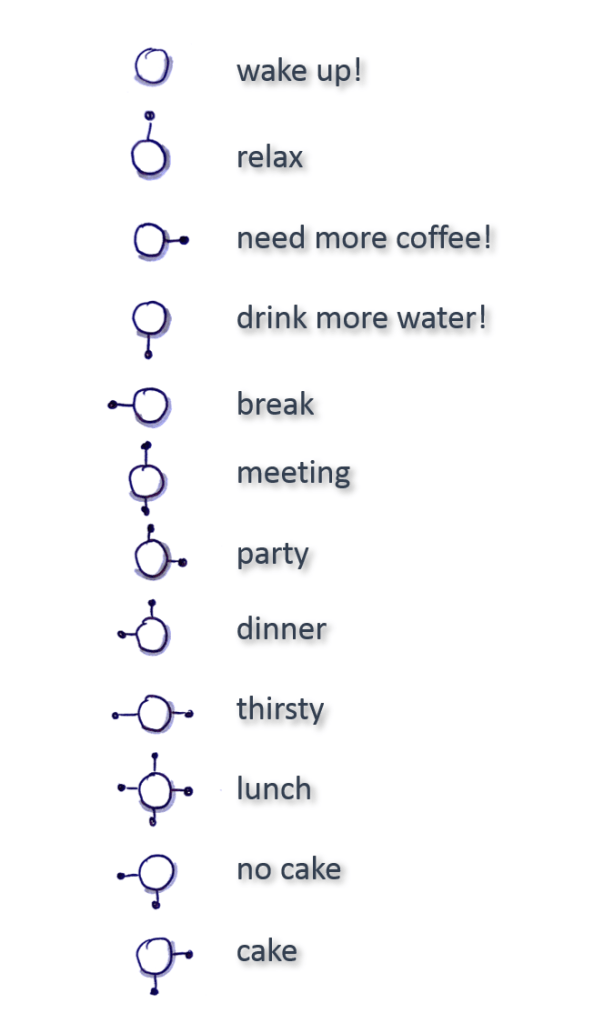
the legend
Having some explanation is always good and helps you to tell your data story. While colour stands for coffee or water, the antennas mark the context and tell you when and why I was drinking.
my findings
Translating data into visualization has a big advantage: You can see patterns. Can you?

So, this is what I found out.
In two weeks time, I was drinking 27 cups of coffee and 58 glasses of water. That makes two cups of coffee and four glasses of water a day. Hm.
I need coffee to wake up and I need it every morning. This was not very new to me. But what you can see too is, that – at least for these two weeks time – I have a daily routine. And you can even see the weekends 😉
I drink more water in the afternoon and no coffee after four. (Probably, because our cafeteria is closed by then?)
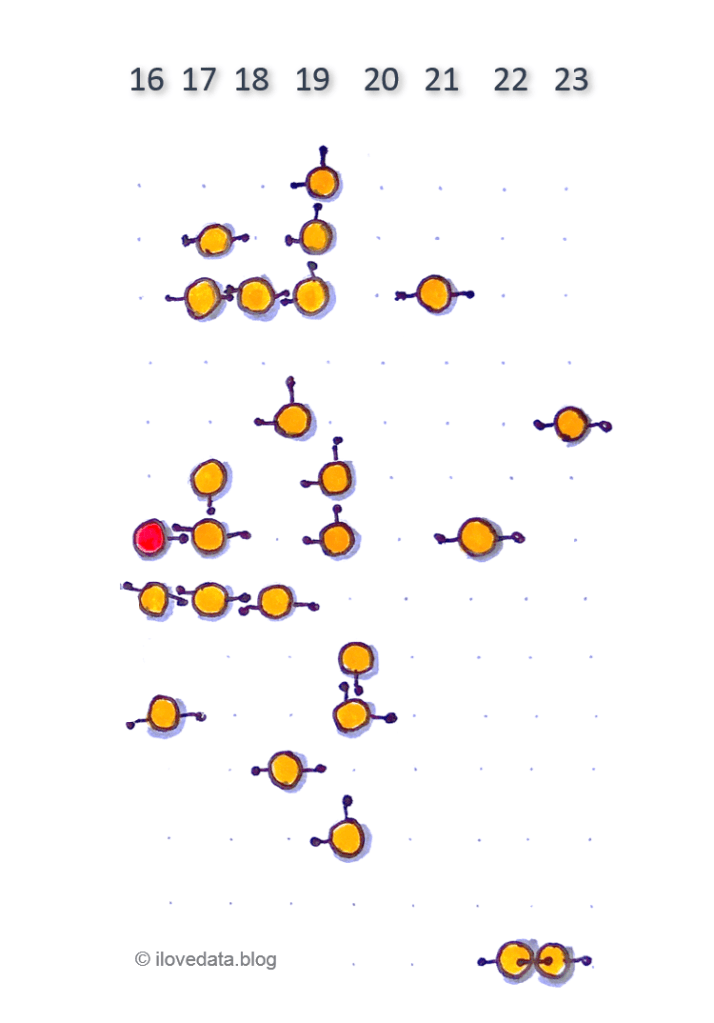
There were 4 days, where I was drinking water because I was very thirsty.

What else? I never drink coffee and water at once. 😉
the learnings
I am okay with how much coffee I drink. Two cups a day, I am totally fine. I thought it would be much more.
But, I must drink more water. Four glasses a day is definitely not enough!

No need to worry.
According to different sources, the body can produce about 300 milliliters in its metabolic processes itself, about one liter of water he gets over solid food.
For example, apples, vegetables and potatoes contain about 70 percent water, cucumbers as much as 95 percent.
The remaining amount of liquid, so good 1 to 1.5 liters, you have to take on drinks. And that is possible. 🙂
side effects of selftracking
Tracking my behaviour, led almost automatically to paying more attention to it. You can see that with the data points and context drink more water!. Thus, I drink more water now.
Thoughts on the analysis and what to do different next time: I was not only drinking water and coffee during that time. To give a complete picture of my drinking behaviour, I could have added that too.
I love the dots and will do a new art project containing data.
I definitely gonna make more selftracking projects.
So, what to track next?
